
2023 International Mass Timber Report / Mass Timber Performance Index
Mass Timber Performance Index
Roy Anderson
Vice President, The Beck Group
In Figure 1, we update the Mass Timber Performance Index (MTPI) that first appeared in the 2022 edition of the International Mass Timber report. The MTPI is meant to serve as a general guide to Cross-Laminated Timber (CLT) panel pricing. It’s general because the values that appear in Figure 1 are based on a financial model of a CLT manufacturing plant that projects the cost of producing mass timber panels. In other words, the prices shown in the figure are not prices reported from actual transactions between mass timber manufacturers and their customers. The data is informative, nevertheless, because it helps architects, building developers, and others interested in mass timber construction understand the approximate cost of their materials.
For about 4 years, the MTPI ranged between $20 and $25 per cubic foot. In the second quarter of 2020, however, the MTPI shot up, eventually reaching more than $45 per cubic foot in early 2021. It then plummeted in the third quarter of 2021, only to climb sharply once again in early 2022, followed by another dramatic decline. At the end of 2022, the MTPI was back in the normal historical range.
The cost of lumber is the driving factor in the observed MTPI changes. Lumber price volatility is a result of supply and demand factors that combined during the COVID-19 epidemic to increase demand for lumber and simultaneously constrain the ability to produce it. Finally, when considering MTPI values, remember they are based on the estimated average value of 3-ply CLT panels Free on Board (FOB) the manufacturer’s plant with no extra costs assumed for final machining, addition of hardware, or transport to customers. The values on the left axis of the figure are the prices expressed in $/cubic meter; the values on the right axis are the prices expressed in $/cubic foot.
LUMBER PRICE VOLATILITY DISCUSSION
Softwood lumber, the main raw material used in CLT panel manufacturing, is a commodity. Like any commodity, its price is subject to the interaction of supply and demand. Between 2000 and 2020, for example, the largest year-over-year change in the average annual lumber price was a 28 percent increase in 2010 relative to 2009 coming out of the Great Recession. Lumber demand had plummeted to all-time lows and then climbed back to more normal levels in 2010. In contrast, the average lumber price increased by 52 percent in 2020 relative to 2019, followed by a 49 percent average lumber price increase in 2021 relative to 2020.
In other words, the lumber price increases observed during the height of the COVID-19 pandemic were unprecedented. Going forward, lumber price volatility, and therefore mass timber panel price volatility, likely will not reach the levels seen in 2020 and 2021. Should this prediction prove true, mass timber panel manufacturers and their customers likely will see more consistency in the pricing of mass timber panels and glulam beams. Of course, another shock to lumber supply or demand, such as another pandemic or major natural disaster, could cause more dramatic price volatility than expected in the near term.

FIGURE 1: MASS TIMBER PRODUCT PRICE INDEX ($/METER3 LEFT AXIS AND $/FT3 RIGHT AXIS)
NORTH AMERICAN MASS TIMBER: LUMBER USAGE, MASS TIMBER CONSUMPTION, AND MASS TIMBER IMPORTS
Another topic of great interest to those following the mass timber industry is North American mass timber manufacturing plants’ rate of production. Like mass timber market prices, little solid information is available directly from manufacturers about their production capacity and production rates. Nevertheless, this section provides estimates of North American mass timber production and lumber use from 2019 to 2022.
As shown in Table 1, the volume of mass timber products used in building construction each year has increased steadily, starting with a little over 280,000 cubic meters in 2019 and ending at nearly 362,000 cubic meters in 2022. Thus, growth of mass timber usage is steady, but not doubling every two years as previously projected. The table also shows a corresponding jump in lumber use in 2022, with total usage reaching more than 287 million board feet. Note that as described in chapter 4, glulam production has consumed about 300 million board feet of lumber annually in North America in recent years. The lumber consumption shown in Table 1 is incremental to the glulam usage.
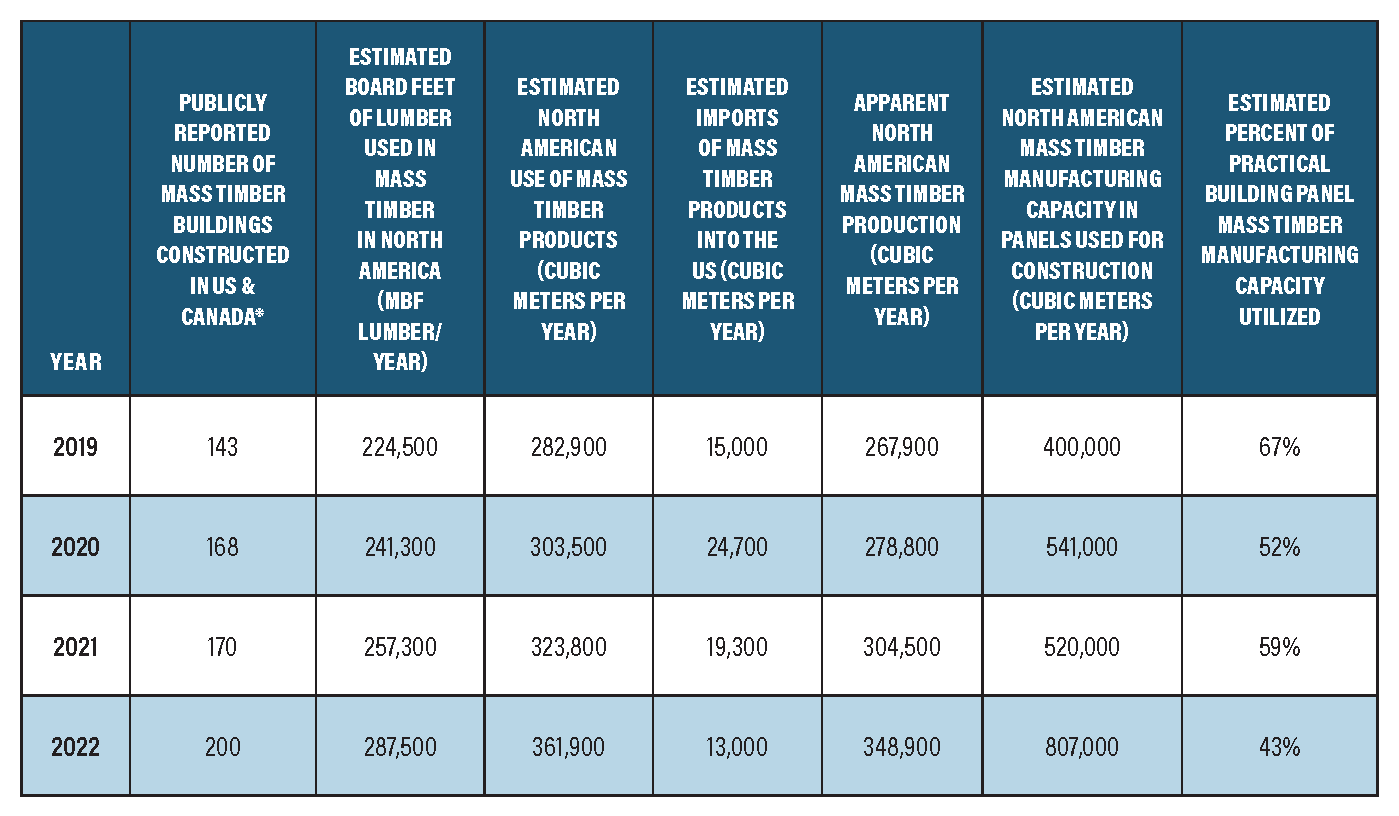
TABLE 1: ESTIMATED NORTH AMERICAN MASS TIMBER LUMBER USAGE AND PRODUCTION (2019 TO 2020)
MBF = 1,000 board feet
*Source: WoodWorks USA and WoodWorks Canada
Mass timber products are still being imported into North America. Thus, some of the apparent mass timber use in North America comes from overseas and must be subtracted from the total to estimate the capacity at which the North American mass timber industry operated in 2022. As the data in the table shows, while there was an increase in mass timber production in 2022, manufacturing capacity increased more rapidly. Thus, as a whole, the industry operated at lower percentage of capacity in 2022 than 2021 (i.e., 43 percent in 2022 versus 59 percent in 2021). This is a low utilization of capacity relative to many forest products manufacturing sectors.
Estimating capacity for any industry is difficult because constraints on capacity change as various supply and demand factors shift. For mass timber, estimating capacity is especially tricky because it depends on how efficiently press capacity is utilized. In addition, some producers shift their capacity between producing mass timber for building construction and for utility mats.
NORTH AMERICAN MASS TIMBER LUMBER USAGE AND CAPACITY DISCUSSION
As the data in the Table 1 shows, the number of buildings constructed with mass timber in the US and Canada increased by about 17 percent in 2022 relative to 2021. As previously described, this continues an upward trend in mass timber building construction. See chapter 8 for additional market analysis. Many more mass timber projects are in the planning stages, and the number continues to grow. In late 2020, about 600 projects were in the design phase; in late 2021, that number had grown to 700; as of late 2022, it stood at about 767. As a point of reference to the analysis presented here, the Softwood Lumber Board commissioned a Mass Timber Outlook1 study, which it published in October 2020. A key finding was that by 2025, the mass timber market (glulam and mass timber panels) would experience an incremental annual gain in softwood lumber usage of 800 million board feet. Per the data in the table, the estimated annual lumber consumption from mass timber was about 241 million board feet per year at the time the lumber board released its report. An 800 million board foot increase would move annual consumption from mass timber to 1 billion feet per year by 2025. Although mass timber construction continues trending upward, the number of building projects using mass timber would need to increase significantly over the next couple of years for the board’s projection to likely be a reality.
Regarding the methodology used in the analysis, estimated lumber consumption is derived from total square footage of mass timber buildings constructed per year (as publicly reported by WoodWorks); a mass timber usage factor per square foot of building; a lumber usage factor per cubic foot of mass timber; and an adjustment factor to account for mass timber buildings not included in the WoodWorks database. Regarding the estimate of capacity, the key assumption was that each North American manufacturer operates at about 65 percent of the maximum press capacity.
1 Softwood Lumber Board. Mass Timber Outlook. October 2020. Accessed at: https://softwoodlumberboard.org/wp-content/uploads/2021/03/SLB-Mass-Timber-Outlook-2021-Final-Condensed.pdf
